Why are some horses better than others?

This is the basic question pondered by all associated with the breeding and racing of Thoroughbred racehorses.

The Thoroughbred is an artificial and genetically diverse breed, as indicated by the variety of physiques, conformation and levels of performance. There are many different gene versions in the breed. This is a strength because it maintains genetic health but it is also a weakness. Too much variability leading to reduced desirable gene fixation in a horse results in lack of adaptation and poor performance. The majority of Thoroughbreds are ‘mongrels’ and lack specialization. The better performers carry sets of co-ordinated genes that contribute towards a clear performance category.

How can we use this information and how can Thoroughbred Genetics help?

Achieving the correct balance between genetic health and gene fixation is important. Genetic management forms the basis of our DNA and performance data analyses, which are based on multiple gene marker approaches, incorporating the results of our scientific research.

This high genetic variability means that major performance characteristics (including speed/stamina balance) are not controlled solely by any single gene. Individual genes may certainly correlate with a particular trait but they are generally part of a ‘mixture’, where strong correlations and interactions are also found with many other genetic combinations.

It is absolutely impossible to consider any single gene in isolation because there are so many interactions and modifying factors involved in the final genetic outcome. Therefore, we don’t do it. We employ a series of key DNA tests and/or genetic databases that help co-ordinate or identify genetic combinations that support common speed, stamina, precocity and performance objectives in a horse. Our DNA analysis systems are like no other available in that they describe the whole horse and not just a single component and give a complete overview at very competitive prices. Our suite of tests have been applied to winners of premier races such as the Japan Cup, Melbourne Cup and Epsom Derby. They are refined and updated on a regular basis.

For example, we don’t just assess a single gene for speed/stamina but consider larger gene sets. The difference between a successful sprinter or stayer is based on different sets of interacting genetic components, not a single gene. There are not necessarily ‘good’ or ‘bad’ genes in these sets but genes that go together and genes that don’t. Co-ordinated parts are used to make a Formula 1 racing car – horses are no different.

Our DNA analyses of stamina and speed are based on multiple gene marker approaches incorporating the results of our scientific research. Our philosophy is founded on exact scientific research (such as our 2006 study of mitochondrial genes – the first scientific study to show a genetic association with performance in Thoroughbreds….) but has developed over the years to incorporate broader genetic interactions including these and other genes.

The chances of breeding a successful racehorse are clearly influenced by probability-dependent genetic occurrences. Our aim is to manipulate and identify genetic probabilities in a more structured manner. We seek to help our breeding and racing clients produce or select ‘complete equine packages’ that have been assembled with coordinated genetic components to do a specific racing job and are likely to be genetically adapted to higher levels of success in a particular speed or stamina niche.

Assessment of respiratory/energy release genes:

There are 4 respiratory gene complexes that affect performance and are of primary importance to our assessments – NADH Dehydrogenase, ATP Synthase, Cytochrome Oxidase and Cytochrome b.

There are two points to note regarding these different complexes: firstly, they are all part of a wider metabolic cycle called Oxidative Phosphorylation (OXPHOS) that converts glucose into the energy rich compound ATP that provides the fuel for cellular respiration and energy release; secondly, the enzymes involved are coded by mitochondrial genes (passed on only by the dam) and also by chromosomal genes passed on by both sire and dam. There are positive and negative interactions depending on which mitochondrial/chromosomal combination of gene versions are inherited from the parents. Part of our overall assessments is based on determining these combinations for individual horses.

Importantly, because of these gene interactions, it is clear that many stallions produce better progeny when crossed with mares from specific mitochondrial types. We, therefore, use databases that tell us which stallions are better used with specific mares and also of the likely effect on the stamina of the progeny.

Multiple marker relatedness/cluster analysis:

The OXPHOS gene combinations are critical to our analyses but it is still important to recognise the broader multi-gene nature of racing performance. It is clearly not necessary to investigate thousands of genetic positions, since not all of these are related to performance but we use what we consider to be an optimum number of genetic markers. This generally takes into account between 75 and 750 genetic positions of relevance.  These have been determined by studies associating presence or absence of DNA markers with performance, relatedness and stamina levels amongst a reference group of thousands of horses varying in these factors.

As an example, gaining an idea of a mare’s genetic stamina, precocity and performance cluster can assist us in directing the genetic profile of her progeny, determining which sires might best achieve this and even, what the potential stamina range an eventual foal may have.

The chart below illustrates such an approach. It is possible to group horses into clusters based on similarity of DNA profile via a statistical process called PCO. All of our performance correlations are based on results from thousands of horses but for presentation purposes and except for the ‘subject horse’, each symbol in the chart refers to a DNA score from a known horse of Gr1 level performance grouped on stamina, precocity and performance range. The graph below is an updated (2016) DNA chart for an Australian mare, Sacred Habit (owned by Ken Williams’ Tarcoola Stud), which, using our molecular selection tools, produced the multiple Grade 1 winner, Sacred Choice.

Notably, if a horse’s position on the graph lies further away from the main diagonal axis of distribution, it is statistically less likely to be a higher performing individual in racing or breeding due to lack of genetic specialization. The method not only determines the  underlying speed/stamina and precocity niche but also the likelihood of success within that niche. The chart at the bottom of the page is more descriptive of this and defines confidence intervals within which a horse can be described by class. Class A being most likely to be a Group/Graded performer, through to Class D – the least likely.

Inbreeding or Outbreeding? – Determination of heterozygosity and homozygosity:

A better indication of the level of inbreeding of a particular horse is provided by use of DNA analysis to measure gene duplication. Inbreeding leads to an increase in homozygosity (gene duplication). Inbreeding is the best way of fixing consistent, positive genetic characteristics but only if duplication of the less desirable ones is avoided. Using DNA markers we have been able to determine that there is an optimum amount of gene duplication that occurs in the best performers and this also varies according to stamina range. A pedigree might indicate that an animal is actually inbred whereas often the converse exists and vice versa. Inbreeding is beneficial but only when applied under the right circumstances. Through use of DNA assessment we can obtain a clearer picture of how close this can be carried out and whether it should be avoided or increased. It is more accurate to use a DNA sample to determine this but we have also been able to extrapolate data that more accurately indicate suitable on-paper inbreeding when this is required.

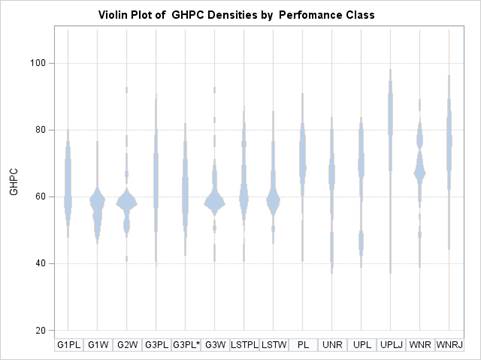
Different levels of performers have their own genetic signatures as far as inbreeding level is concerned. The diagram above shows graphic inbreeding (GHPC) plots for different classes of horse, ranging from Group 1 winners to Unplaced jumps horses. It is clear that the shape of the plots which cover the most common inbreeding range (in percentage) varies between class. This is yet another genetic feature used to determine adaptation of a horse to a specific genetic niche and performance level.

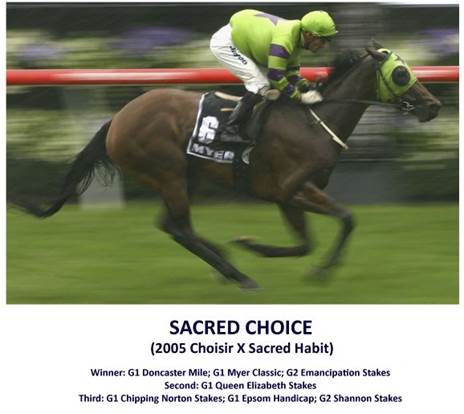
Taking account of a horse’s heterozygosity enables prediction of the potential status of resulting foals. This allows us to aim for the optimum level in the foal, giving the best chances of performance and breeding success. Using the same example as above, the heterozygosity of Sacred Habit was very low, at around 42% – i.e inbred. Prior to analysis she has produced a series of foals that exhibited various conformational problems. Assessment of her heterozygosity, stamina clustering and OXPHOS status indicated to us to make the recommendation of Choisir as a potential mate and this successfully produced Sacred Choice.

What is the end result – what do we have when all of the tests have been applied?

In essence – a complete genetic description of a horse. Whether the horse is a youngster yet to race or a prospective broodmare, the tests provide information that can be interpreted to bring out the best in both. The results will tell us: the speed/stamina bias; precocity expectation; level of inbreeding; likely performance and breeding level. We will also be able to tell whether these interacting features complement each other to make a ‘complete’ animal.

The uses and applications are broad. Knowing the genetic status of a mare or stallion enables selection of the most appropriate mate to support their strengths or weaknesses in order to produce progeny conforming to the best possible genetic profile. Similarly, knowledge of the status of a young horse can support sales and racing decisions.

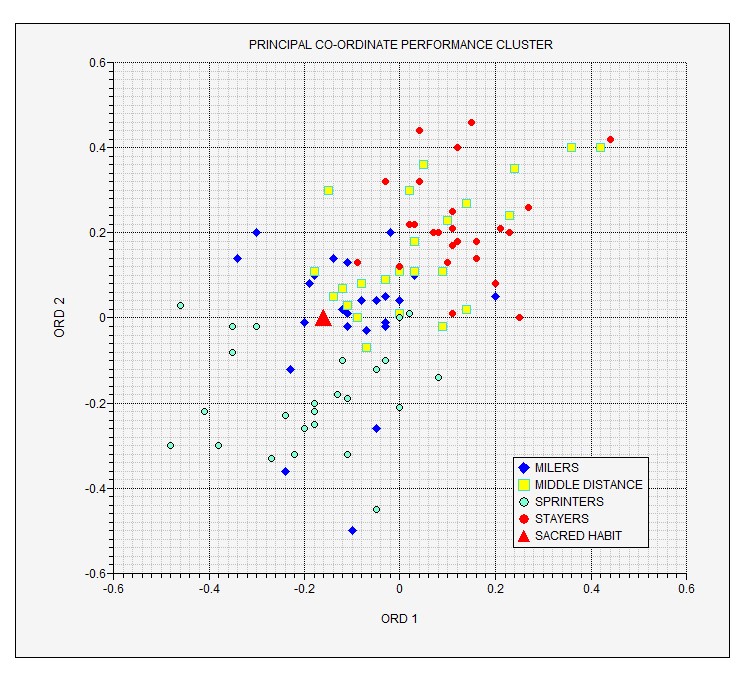
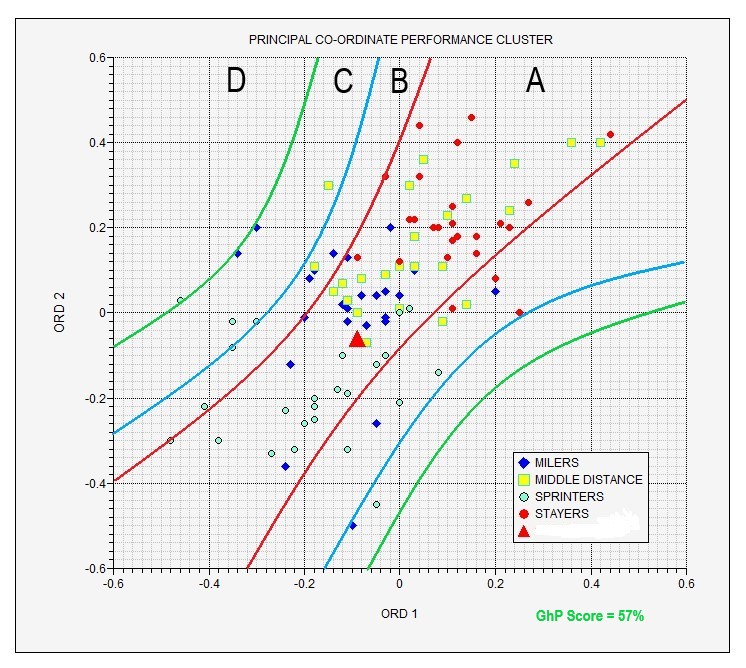
The expanded example graph shown below indicates that the horse denoted by the red triangle has the profile of a 7-8f (1400-1600m) horse. It is positioned with the early-mid 2yos. It falls into the confidence interval of horses more likely to be ‘A’ Class performers. It is also inbred (GhP=57%) within the optimum zone for a horse of this stamina/speed balance and this also conforms to the inbreeding level seen with higher level performers in this stamina range.

Related Articles